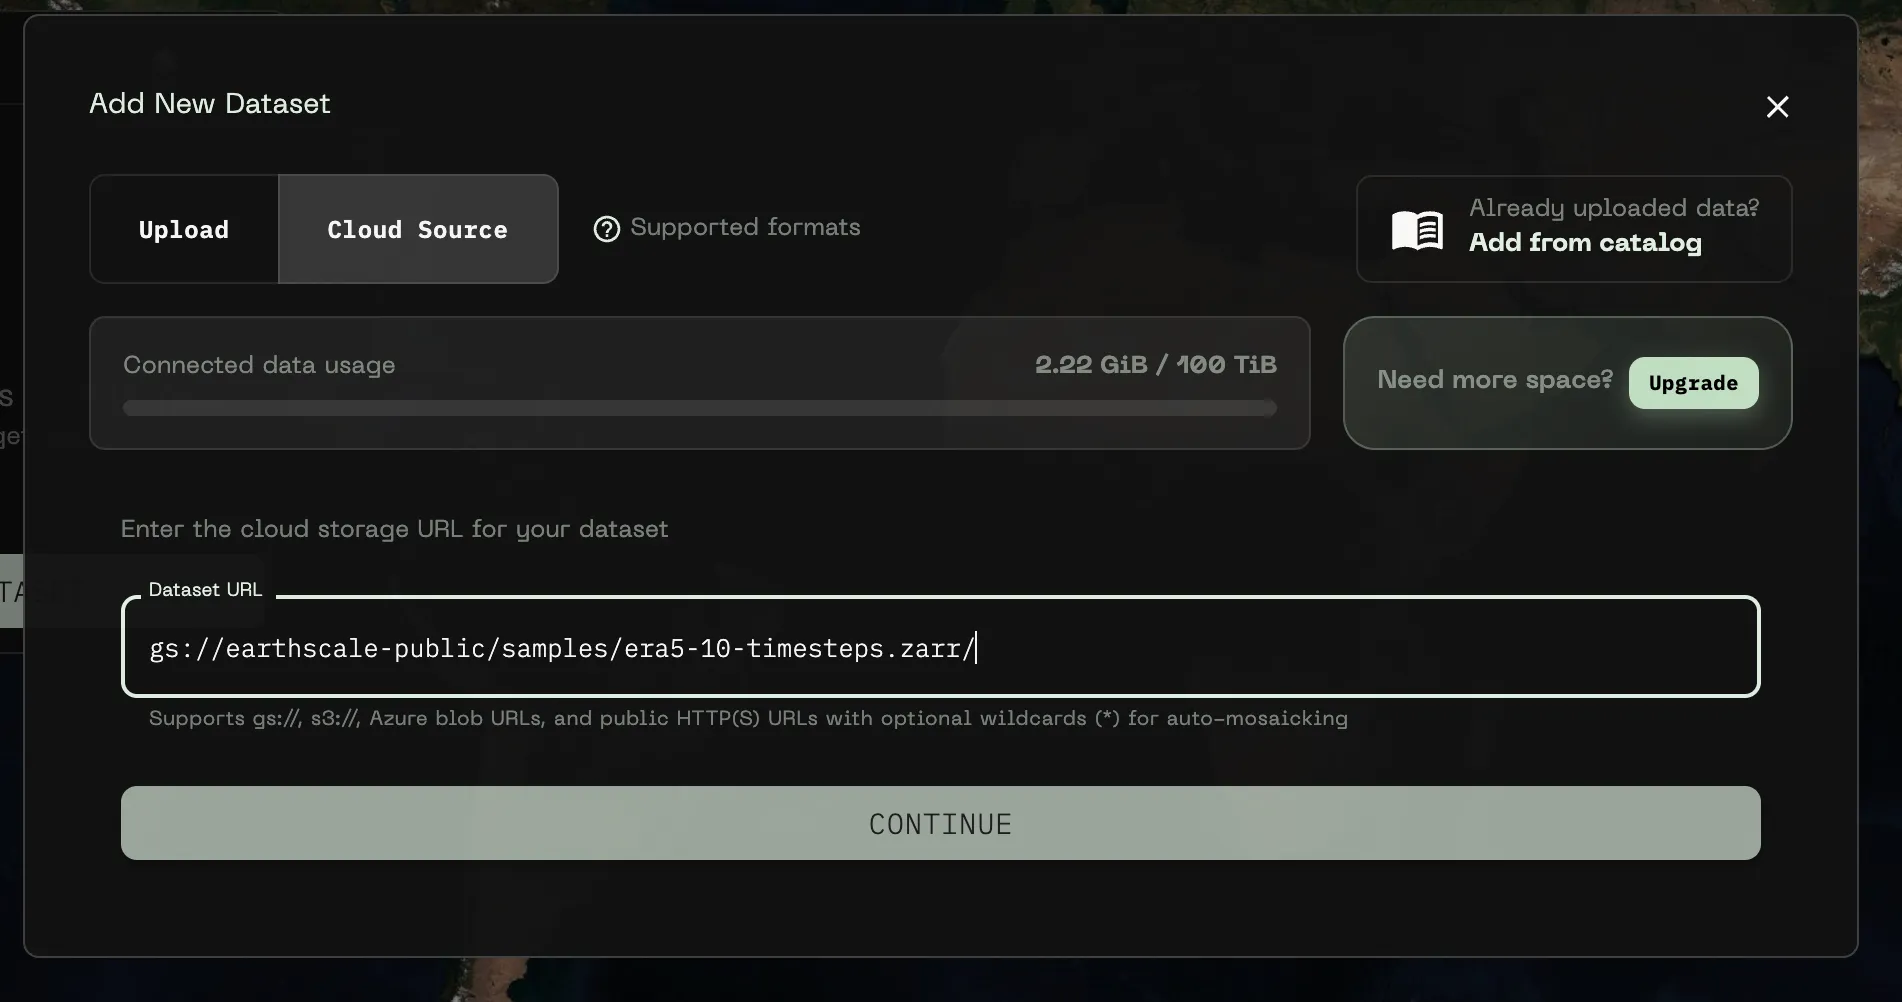
Quickstart

The fastest way to get started is to add some example data and explore the user interface. This lets you try out all the features without having to set up credentials.

Add an example dataset

When you open Earthscalearrow-up-right, there is a sidebar on the left-hand side that shows your current map and allows you to add new data.

Click on "Add new dataset"

To test things out, we're going to register a public cloud dataset. To do so, switch to the Cloud Source tab, and use the following URL as an example Dataset URL:

Click Continue to proceed. Earthscale will now read the metadata (location on the map, resolution, projection, etc.) from the dataset. Once this process is finished, the dataset should appear on the map.

Editing the visualization

Now, try switch the band and/or update the maximum value to update the visualization in real time. To do so, you can either use the three dots and then select Edit Visualization or

You can use the arrow at the top right of the editor to get back to the map or alternatively press Esc.

Click on the map to get pixel info

To get the exact value of a pixel, just click on it:

This places a marker at the exact location that was clicked. On the right-hand side, you can find the coordinates of the point as well as the pixel values for all bands at this location.

All visible datasets at the clicked point are queried, but you can disable or enable specific ones by clicking the table button on the right-hand side.

Working with multidimensional data

The ERA5 weather dataset that we have added in the first step has a time dimension. The Dataset Card allows you to step through the different timesteps

After adding one of these, you can see the all dimensions as well as their currently displayed value below the dataset in the sidebar:

Click a pixel to see additional options for multidimensional datasets. Then Click the chart icon to query the history of the pixel value at the current location:

Next steps

Last updated